
Those of you who do project management with Merlin on your Mac and have checked our post series explaining how to create custom templates for Merlin reports, know by now…
- How to modify existing reports
- How to edit description or report template names
- How to create your own report templates
- How to localize a Merlin report template
- Further tips for localizing an xslt report template
- How to add an option in an xslt report template
- How to add an option in a python / wbl report template
- How to add a property into an existing xslt report
- How to add a property into an existing python /wbl report template
Now let’s do some magic with the reports.
- Map a status or flag information to a graphic file
- Define the size of the project image over the options
- List overdue tasks along with the next activities, in “Next Due Activities” report
- Report planned, actual and planned vs actual work per phase in a chart
- Report expected work costs per role for your resources
- Report expected work costs per resources’ group
- Report the project’s name in the Next Due Activities report
- Modify the “Milestone Trend Report” to show the WBS in the table and in the chart
- Report expected or actual resources’ work per phase
- Report resources work cost per phase
- Report cash flow for expected cost or approved budget
- Report billable costs entered on elements
- Report element costs by type
- Report issues
- Report Events
- Output Project’s WBS
- Resources Time allocation to various tasks and subtasks
- Calendar View
- Working hours distributed in time per resource and assignment
- Work Chart
- Information report with hierarchy
- Complete vs Expected Complete % Analysis
- Resource Groups’ or Roles’ Units Utilization Distribution
- URLs report
- Resources Groups’ or Roles’ Work as distribution in time
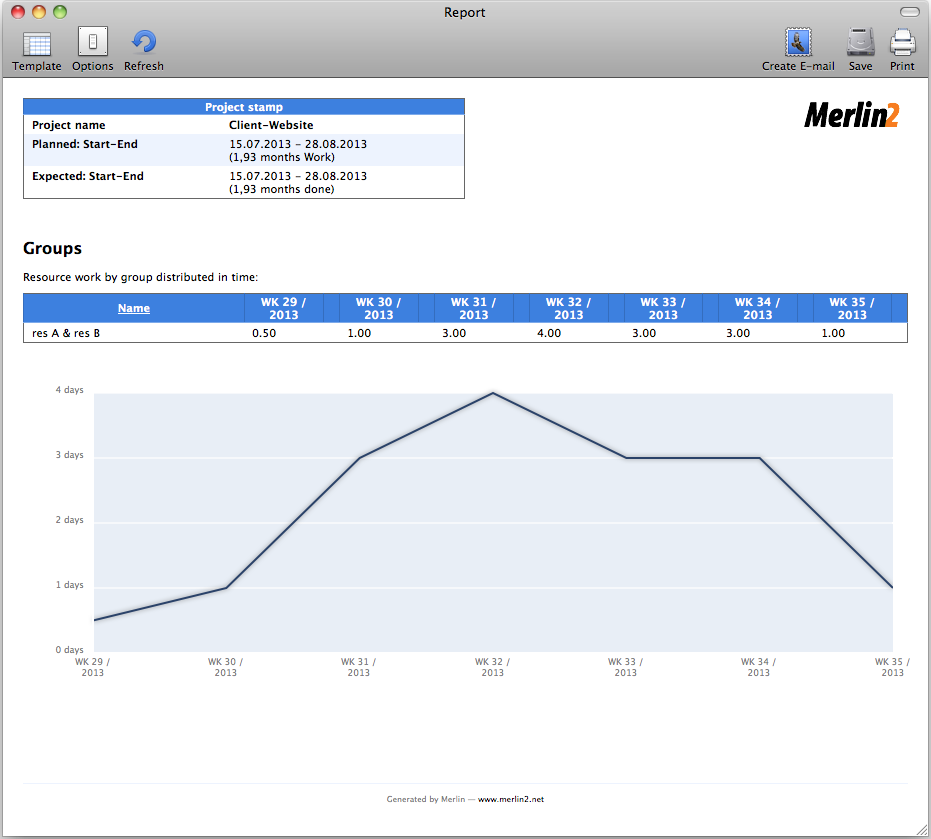
Resources Groups’ or Roles’ Work as distribution in time
We’ve  been asked in Merlin support, how to output work of some specific resources and their distribution in time  as a group. For example for res A and res B 8 hours on day 1, 16 hours on day 2, 0 hours or day 3, etc.
We think this is similar to another custom report template we’ve posted outputting groups’ and roles’ utilization units distribution. Please see more about that template here. So we’ve modified that template (by entering options) to cumulate either utilization units or utilization work.
So one could create a group, group res A and res B into it, use this template and output expected work for their assignments as a time distribution.
Please remember: Custom Merlin reports we provide as templates, can be downloaded and used for free. Furthermore, you may modify and distribute as you like and find appropriate.
An output sample:
 Continue reading
