
Those of you who have checked our new post series about “Merlin report templates” know by now…
- How to modify existing reports
- How to edit description or report template names
- How to create your own report templates
- How to localize a Merlin report template
- Further tips for localizing an xslt report template
- How to add an option in an xslt report template
- How to add an option in a python / wbl report template
- How to add a property into an existing xslt report
- How to add a property into an existing python /wbl report template
Now let’s do some magic with the reports.
- What if you want to map a status or flag information to a graphic file?
- What if you want to be able to define the size of the project image over the options?
- What if you want to list overdue tasks along with the next activities, in “Next Due Activities” report?
- What if you want to report planned, actual and planned vs actual work per phase in a chart?
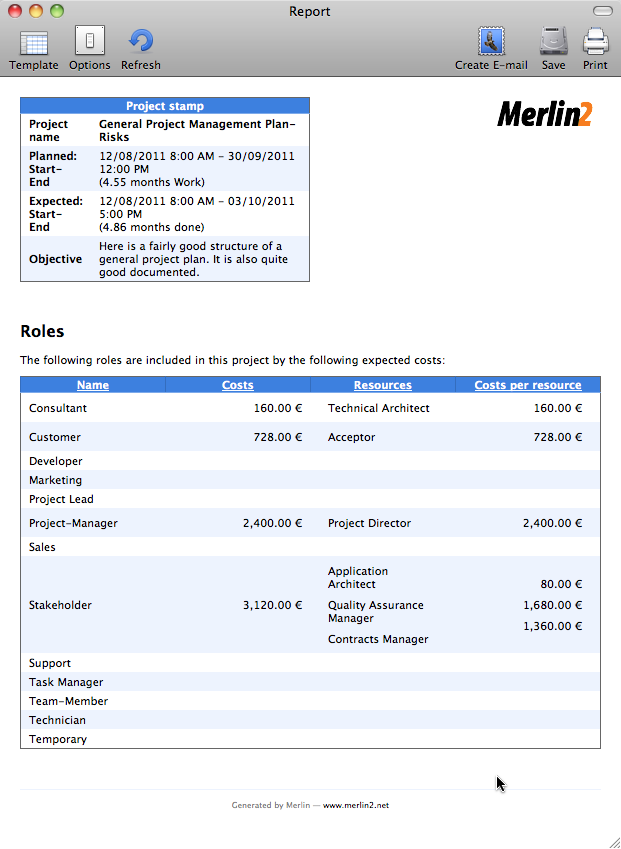
- What if you want to report expected work costs per role for your resources?
- What if you want to report expected work costs per resources’ group?
- What if you want to report the project’s name in the Next Due Activities report?
- What if you want to modify the “Milestone Trend Report” to show the WBS in the table and in the chart?
- What if you want to report expected or actual resources’ work per phase?
- What if you want to report resources work cost per phase?
What if you want to report resources work cost per phase?
We have used snippets from previous report templates posted in this series and related thread of Merlin’s user forum in Google.
In the WBL we mainly output all resources in the header of the table. This is possible over the following method in the Python script

And related WBL code iterating their titles

Continue reading

