
Those of you who have checked our new post series about “Merlin report templates” know by now…
- How to modify existing reports
- How to edit description or report template names
- How to create your own report templates
- How to localize a Merlin report template
- Further tips for localizing an xslt report template
- How to add an option in an xslt report template
- How to add an option in a python / wbl report template
- How to add a property into an existing xslt report
- How to add a property into an existing python /wbl report template
Now let’s do some magic with the reports.
- Map a status or flag information to a graphic file
- Define the size of the project image over the options
- List overdue tasks along with the next activities, in “Next Due Activities” report
- Report planned, actual and planned vs actual work per phase in a chart
- Report expected work costs per role for your resources
- Report expected work costs per resources’ group
- Report the project’s name in the Next Due Activities report
- Modify the “Milestone Trend Report” to show the WBS in the table and in the chart
- Report expected or actual resources’ work per phase
- Report resources work cost per phase
- Report cash flow for expected cost or approved budget
Report cash flow for expected cost or approved budget
We have used snippets from the ‘cost distribution’ report template as basis.
In a Python method we collect all tasks with group and sub-tasks.
In the WBL we iterate in this array and output the desired values

Getting the task number is easy, you need to ask its flatOrder. ‘title’ and ‘expectedCost’ bring the total costs of each item. The method spaceByLevel places a space before the item’s title for indentation purposes. It calculates as 15px per level.

For the distribution in time of expectedCosts or Budget, the following method was used:

and the wbl code outputing it

Making it flexible:
To make the report more flexible we have inserted an option to show assignments or not.

If it is set, method ‘addActivitiesAndChildActivitiesDeep’ collects all tasks. If it is not set, assignments won’t get collected.

Some users would like to output the approved budget instead. For those users an option was added and the related methods asking for approvedBudget were implemented.
Result
An output sample:

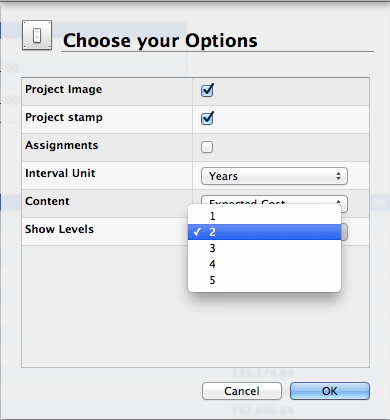
And the report options:

Update: Dec 16th, 2014: When having a big project with lots of tasks and levels running long time, you might want to limit the output of the report to a specific level and make a smaller report which is easier to handle. So I modified the template to contain an extra option for showing levels. Please check the current report options:
Installation:
- Extract the zip first
- place the contained mrept package under the following path of your mac: ~/Library/Application Support/Merlin/Reports
- (in case you have no “Reports†folder please create it first and pay attention to name it exactly as “Reportsâ€)
- restart your Merlin and
- call File > New Report… to find the new report called “Cash flowâ€.
Hi,
I want to add a man hour report along with this cash flow report. Is there a way to see how many hours a resource/person have spend on a project?
The table would look something like this:
Title | Hours Used | Standard Rate | Total Cost
Project Manager | 20 Hr | $100/hour | $2000
Developer | 30 Hr | $150/hour | $4500
Thx
Hi Rizky,
you may get this information in Merlin ‘Resources’ View. Just enable the required columns, disable others, enter custom names to the shown columns (View > Show View Options > Columns > Custom)
and call File > Print > PDF to forward this as report.
For an extra table in an existing report… you would need a method in Python gathering resources:
Like the following…
And in the wbl part you iterate in those resources, and show desired values. By ‘Hours Used’ do you mean planned or actual work? And they should be recalculated in hours no matter if Merlin calculates them per default in another unit?
Anyhow for planned work and standard rates…
please check this
For actual work and actual work costs…
please check this
This report looks fantastic!
Is it possible to output this as an excel or csv file, instead of html?
Nice work!
You can select with your mouse the contents of the table (or even the complete report text), copy and paste in an empty EXCEL sheet.
The report templates are implemented to produce html content, for the report window to browse it.
Thanks for your commend Adam and best regards, Vicky
Pingback: Merlin - Do a little bit of magic in Merlin reports - part XXV » MacPM
Please advise how to generate a cash flow report, I do not see the option in template window ?
I am currently on a demo user version, I wish to check the user interface and options before I buy the license.
I basically need to see expected or approved cost per period i.e. week, months, quarter , year etc
Please advise
Hello Paul,
the report template behind the ‘zip’-Link can generate such a report. But off course you would need to proceed with the installation as explained in the post to be able to use it it.
Best regards, Vicky
Hi Vicky
I have imported the above report template into Merlin (2.9.3) and when I click on the generate report it only shows a blank screen.
Any idea why this would not display?
Do other reports (for example the ‘Classic Report’) output information?
Do you have pricing rates on your resources?
Or standard costs on your project?
Maybe it is a much too long project to proceed?
How many rows in total?
Or maybe you have too many values for the report to show? Try in the options to output ‘Quarters’. Will the be no outputted?
Best regards, Vicky
Can this be modified to show approved budget and base costs together and show the difference (I am using base cost as accepted tender amount)
Be my guest to change the termplate so it shows budget and expected cost at the same time. If I am not mistaken you cannot calculate base costs distributed in time.
The easiest would be however to download Merlin Project, open your Merlin 2 file there and use the ‘Work breakdown > Plan / Actual comparison (cost)’ view and choose to show in a time phased row the ‘approved budget’ instead of the ‘planned costs’.
Best regards, Vicky
Does anyone know how to get this report to work in Merlin 3. I follwed the steps above, but the report does not appear. I am a Project Manager, and not a developer, so the Python stuff etc. is a little confusing. I just need a cash flow report either by week, month or quarter.
Thanks a lot
This report is for Merlin 2.
For a cashflow in Merlin Project just switch to the Work breakdown > Cost Expectation view and show the Gantt.
For the values to show up by week, month or quarter, just click the Gantt headers and select the desired unit in the Time Scale inspector.
Best regards. Vicky
Hi Vicky,
This is service, thanks.
However, I am new to Merlin 3, when you say “show the Gantt, how do I do that. I go to View > Work Breakdown > Cost Expectation, but how do I show the Gantt?
Thanks again for the quick response!
Hi Louis,
if the Gantt isn’t already visible, you can show it by a secondary click onto the outline (the rows showing the values in the columns) and select then ‘Show Gantt Chart’
Best regards, Vicky
Hi Vicky,
Thank you very much for your help. I managed to get it right. It does help with the view, and helps a lot.
I there however not a possibility to have it as a proper report like the ver 2 one, as we need to email the cashflow forecasts of all projects to the PMO for the appropriate funding.
Looking forward to hearing from you.
HI Louis,
You can export it as PDF by File > Export > Image > PDF
(for your logo you may use the watermark option of the PDF)
or even better, call File > Send as Email and select then Image > PDF…
Latter creates an email and inserts the exported view as a PDF in the message for you to send.
If you need to place the content in a Merlin Project Report view, to make it similar to the built-it reports (ie ‘Report > Milestones’) you may also do this. So you can create an extra report view in which you place the ‘Work Breakdown > Cost Expectation’ project view and activate some specific filters (maybe ‘groups’ or just ‘top level groups’ ).
Best regards, Vicky
PS: You can always reach out to MerlinProject support by email. You will find our email addresses on the website:
http://projectwizards.net/en/about
Dear Vicky,
I’m using merlin2 today with a license, but feel that it is quite have to use, may be because of my skills… Which one of merlinproject and merlin2 is the most user-friendly? It looks like the merlinproject is the one. I’m planning medium size projects, 150 tasks and like to present the cash flow of the project as well as the work tasks.
Which one do you recommend to use?
BR
Henning
Hi Henning, you may use any Merlin version you find easier to use and handle.
For a cash flow in Merlin 2 you may use this custom report template.
Merlin Project already provides a cash flow view in the Gantt of the ‘Work breakdown > Cost Expectation’ view.
Best regards, Vicky