Merlin – AppleScript installer for custom report templates

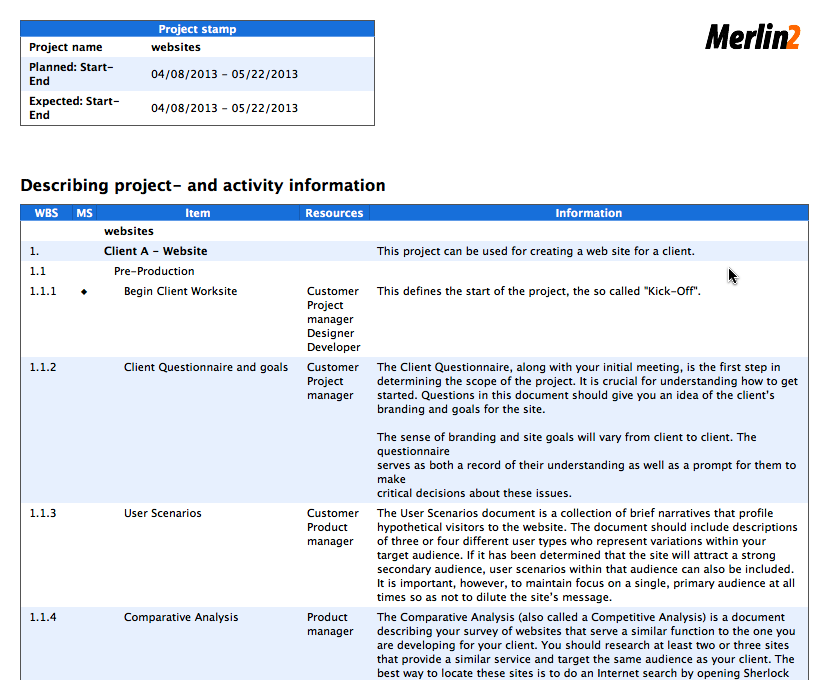
We have a series of posts explaining how to create and modify custom report templates. You will find there descriptions on how to write report code and of course installation instructions for the offered custom templates.

That is, you download and extract the provided zip. Place the contained mrept package under the following path of your mac: ~/Library/Application Support/Merlin/Reports. In case you have no “Reports” folder please create it first and pay attention to name it exactly as “Reports”. Restart your Merlin and call File > New Report… to find the new report listed.

Or… you can use an AppleScript we’ve just wrote checking for the “Reports” folder, asking you to locate the report template (mrept file package) and installing it automatically into the correct path.

To start it for the first time after extracting it from the zip: Right click it, select to ‘open’ and click again on ‘open’.

To use it: Just drag an mrept report template onto it.

Downloadables: ‘InstallCustomReportTemplate.zip


Merlin – Do a bit of magic in Merlin reports – PART XXI

Those of you who have checked our new post series about “Merlin report templates” know by now…

Now let’s do some magic with the reports.


Information report with hierarchy

Merlin contains a report template outputting notes entered on the activities of a project as a flat list. We’ve modified this existing report template to output tasks showing their hierarchy which makes easier to read.

You may check contained ‘Report.xslt’s in German and English.lproj folders to see how we iterate in project’s projects and then get their activities level by level. In the report template we’ve included a space.png which we use to indent the titles row by row according to their level.

Feel free to modify this custom report further as you require for your needs.

An output sample:

Showing information for a master project.

sample

Or by a selected resource…SampleOutputForResource Continue reading

Merlin – Do a bit of magic in Merlin reports – PART XX

Those of you who have checked our new post series about “Merlin report templates” know by now…

Now let’s do some magic with the reports.


Work Chart

If you like to report  expected or actual working hours per resource in a chart and/or table, this is a custom report doing so.

You may check contained ‘WorkChart.py’, “WorkChart.wbl” to see how we iterate in project’s master resources, ask for their working units, compare them with total work hours and output this information in the table. In the pie chart, working hours are forwarded and the pie chart calculates respective percentages. There are methods in the Python part gathering the x- and y-Ticks and some javascript functions drawing the graph. You may furthermore disable outputting resources’ work in the table and define the first 8 colours to be used for the pie chart.

Feel free to modify this custom report further as you require for your needs.

An output sample:

Showing expected work hours by resource.

sample

And the report options: Continue reading

Merlin – Do a bit of magic in reports – PART XIX

Those of you who have checked our new post series about “Merlin report templates” know by now…

Now let’s do some magic with the reports.


Working hours distributed in time per resource and assignment

If you like to report  the distribution in time of expected or actual working hours per resource and assignment, this is a custom report template to use.

You may check contained ‘AssignmentDistribution.py’, “AssignmentDistribution.wbl” to see how we iterate in project’s master resources, ask for their assignments and iterate in time to show the amount of expected or actual work in the selected time interval units.

Feel free to modify this custom report further as you require for your needs.

An output sample:

Showing work hours by resource and week.

resources' work by week

Or resources’ assignments by month Continue reading

MERLIN – DO A BIT OF MAGIC IN REPORTS – PART XVIII

Those of you who have checked our new post series about “Merlin report templates” know by now…

Now let’s do some magic with the reports.


Calendar View

If you like to report  working days of your project’s scheduling and/or assigned resources, this is a custom report template to use.

You may check contained ‘CalendarView.py’, “CalendarView.wbl” to see how we iterate in project’s duration, convert dates to the desired formats and color the table on working days.

Feel free to modify this custom report further as you require for your needs.

Some output samples:

Showing project scheduling grouped by month.

Or resource’s working days grouped by week… Continue reading