Merlin – when to enter an actual start when updating a task

When managing a project with Merlin on your Mac you create your tasks and assign them to your resources. As your resources work on their tasks, you as a PM usually update your Merlin project by entering actual values and record progress.

There are various ways to record progress on your tasks:

  1. You use the ‘Actuals’ inspector
  2. You enter the completion % in the ‘plan’ inspector
  3. You enter the completion % in the according column in the outline.
  4. You select a completion % in the according sub menu of the context menu you get, when you right click a task.

Should you go for the first approach…
You enter first the actual start date and then the progress by entering the percentage of completed work or the absolute work done as explained here.

If you choose to directly enter the progress on the task (without defining an actual start date), Merlin assumes the actual start was the same as the planned start and enters this date as actual start.
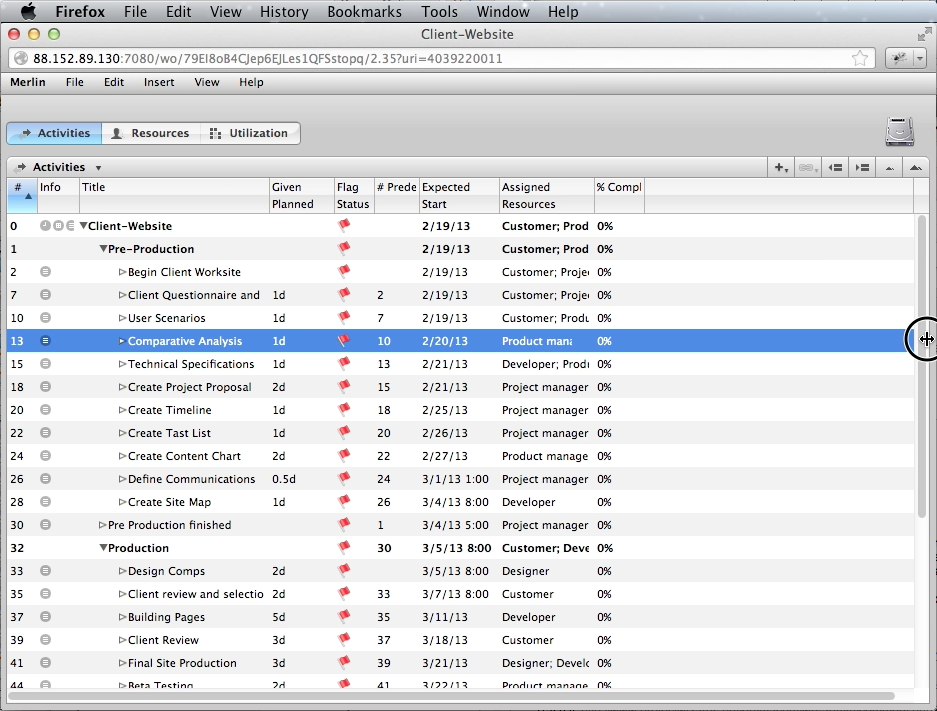
Should there be a difference between the planned and actual start of the task, a grey Gantt element will be shown in addition (for the planned values).

Should you go for approach 2, 3 or 4…
Merlin assumes (as explained above) that the actual start was the same as the planned start and enters this date as actual start.

Continue reading

Applescript – elapsed duration in human friendly time units

When planing and managing your projects with Merlin for Mac OS X you have 4 main windows: Activities, Resources, Netplan, Utilization.

Depending on the view you have selected, the main area offers you different details and information about your project. You can view and in certain cases modify the main outline of your project, adding activities, groups and milestones. Furthermore, this area also allows you to work interactively with the Gantt chart, Netplan and resource utilization.

Per default the label in the Gantt bar show the expected duration in working times. So it may show 2 days for example for a task starting Friday and ending Monday if weekend is defined to be workfree time.

If you want the label in the Gantt to show the real time elapsed, you may do so. Just go to View > Show View Options > Styles
Click into the label you want to edit and select “expected elapsed duration” for its content.

This of course would then show the duration in e-units. What to do if you don’t want those edays, emonths, eweeks to be shown? You may use attached script sample created in AppleScript.

It goes throught all activities of the top most opened project, checks for the expected elapsed duration of the task, and writes it in the subtitle field in human friendly units. If you enable the display of “subtitle” for the label, you are set.

Note: The script cannot create a live connection between the columns “subtitle” and “expected elapsed duration”. That is, before printing your project, make sure you call the script again Gantt  to actualize outputted data. Continue reading

Merlin – Show only Gantt chart, close outline

To hide the outline of your Merlin project, just drag the window divider control which is placed between the Outline and Gantt all the way to the left.

Related posts:

  • Merlin: Gantt chart is missing!
  • Merlin: Moving Elements on Gantt in the timeline
  • Merlin: Adjusting time rulers in the Gantt chart
  • Merlin: Automatic coloring in the Gantt
  • Merlin: How many calendar weeks in a year?
  • Merlin: Linking activities graphically
  • Merlin – automatic coloring in the Gantt

    Merlin has right now 2 concepts of flags for coloring elements in the Gantt chart of Merlin projects. This is done by the flags.
    The auto flag or the one you explicitly set; Red, Yellow, Green

    The explanation on the color coding of auto flags is given in the visual dictionary in Merlin help

    Green for: Activity is complete
    Blue: Activity to start in the future
    Red partially filled: Activity is started but is behind schedule
    Yellow partially filled: Activity is in progress either ahead of schedule or on time
    Red: Activity is late and hasn’t started yet

    What does it mean ‘on time’? Continue reading

    Merlin: Gantt chart is missing!

    movecontrolThinking about the frequently asked questions posed by Merlin users we have found out that the undisputed winner is:

    My Gantt chart is missing! I see only the outline with the tasks but where is the Gantt?

    This is maybe irritating but a simply to solve situation. Supposedly you open a project file and see the outline and all activities or the resources with their assignments in the utilization view but no Gantt chart. You look under the “View” or “Window” menus, hope to find there a toggling “show/hide Gantt chart” menu item, and find nothing. This happens because the Gantt chart hadn’t been removed from the activities view, it was only moved outside the visible area of this window.
    Solution: Simply slide the control on the bottom right of the activities or utilization area to the left.

    UPDATE on May 6th, 2012:
    To hide project’s outline, just drag the window divider control between outline and Gantt all the way to the left.

    UPDATE on March 26th, 2013:
    To show the Gantt area when viewing or editing a Merlin project in the web browser, just move the mouse near the right border of the browser window and drag as soon as the mouse pointer changes and indicates you’ve reached the divider.
    DragFromRightToLeft
    To show the outline area of a Merlin project in the web browser, you’ll find the divider on the left side of the window. Move the mouse towards this end and drag to the right.
    DragFromLeftToRight